Test, record, review: every tool in one workspace.
Tickrivo lets you backtest manually by replaying historical markets, plan and record every trade and analyze the results in detail. This page explains what each feature does and where its limits are.
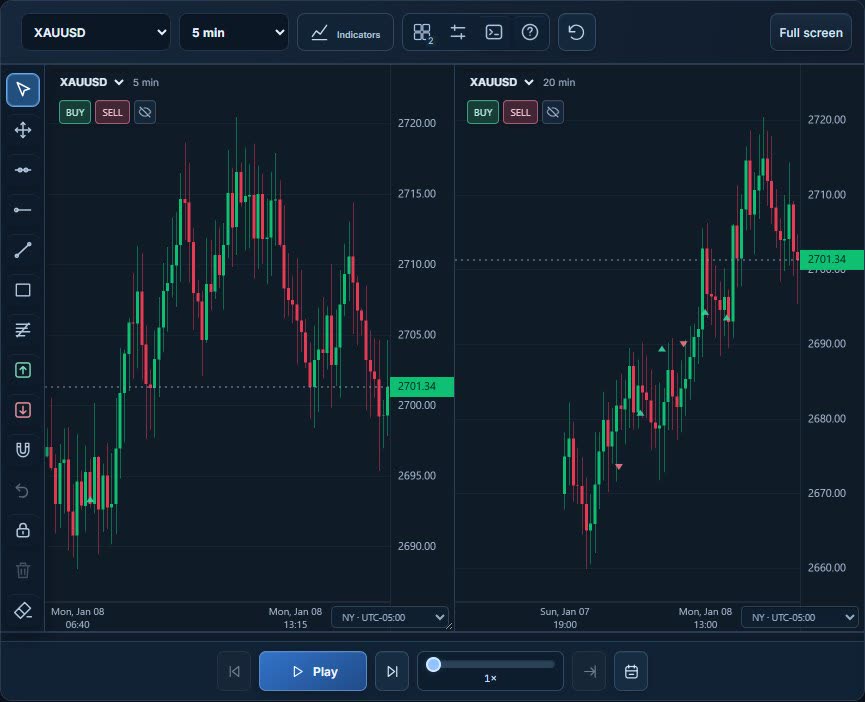
Step through candles one at a time, or play them at the speed you choose, on any market and period you pick. You decide without knowing the outcome, and once a trade is open, jumping back in time is locked so the practice stays honest.
Play/pause, bar-by-bar stepping and playback speed
Jump to a date or candle and add bookmarks
Jump to the London and New York 08:00 session opens in one click
Optional blind mode: hide the date and pair labels
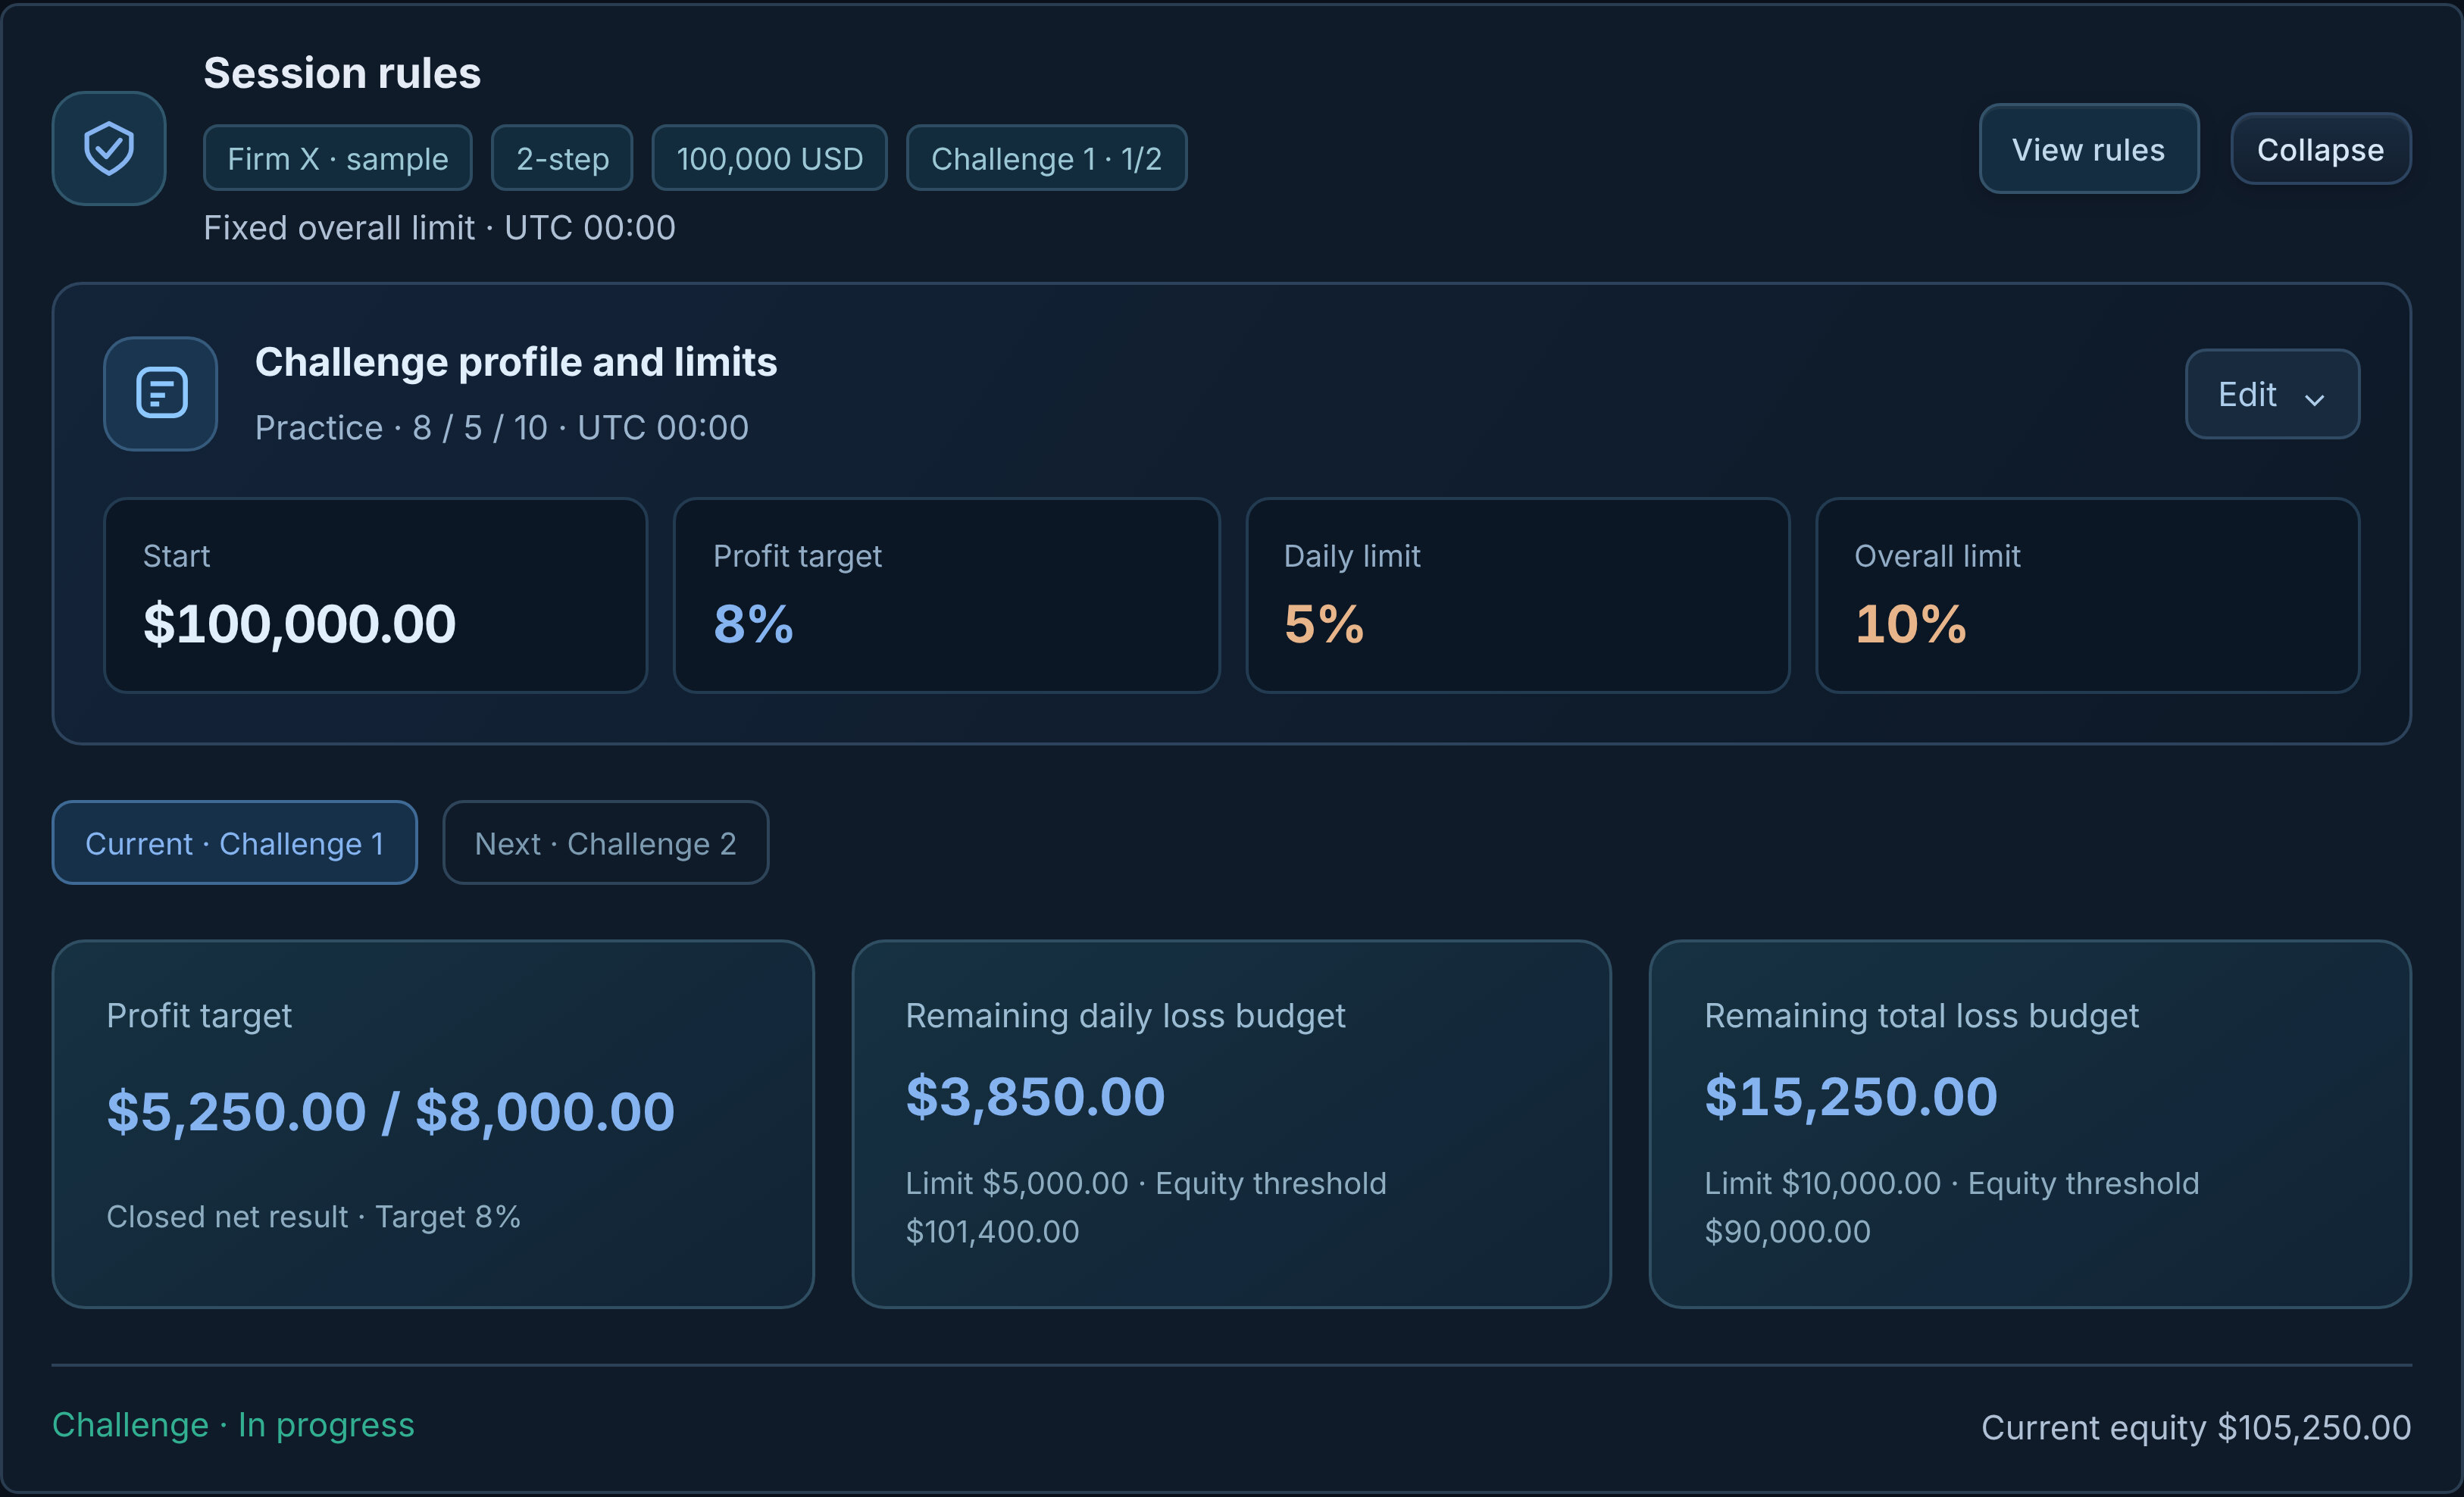
Trade under daily loss, max loss and profit target rules with a sample firm and rule profile. Pick a preset (Practice or Conservative) or build a custom one.
A Challenge control center that keeps the rules in view during the session
Sample one-, two- and three-stage packages
An Achievements screen for completed stages
This is a simulation: it does not offer real funding, a real account or admission to a firm.
Markets, timeframes and your own data
Session setup lets you choose from forex pairs, gold and silver, index and oil CFDs, six CME futures contracts and crypto USDT perpetual pairs. Timeframes run from 1 minute to weekly, and you can import your own CSV candle data.
40 forex pairs: majors, crosses and exotics
Gold, silver, index and oil CFDs
Crypto USDT perpetual pairs
Time zone choice including UTC, Istanbul and New York
CSV import in Dukascopy and HistData formats
Not every symbol has data for every date; coverage depends on the data source and the period.
Drawing tools, indicators and multi-chart
Draw levels, trend lines, Fibonacci and risk-reward zones, and add SMA, EMA, RSI, ATR, Bollinger Bands and volume. Follow one market on 2, 3 or 4 panels, each on its own timeframe.
Send a Long/Short risk-reward zone straight to the order ticket
Indicator presets for trend, momentum and volatility
Build your own indicator with a limited Pine Script subset
Full screen, magnet mode and keyboard shortcuts
Trade and risk panel
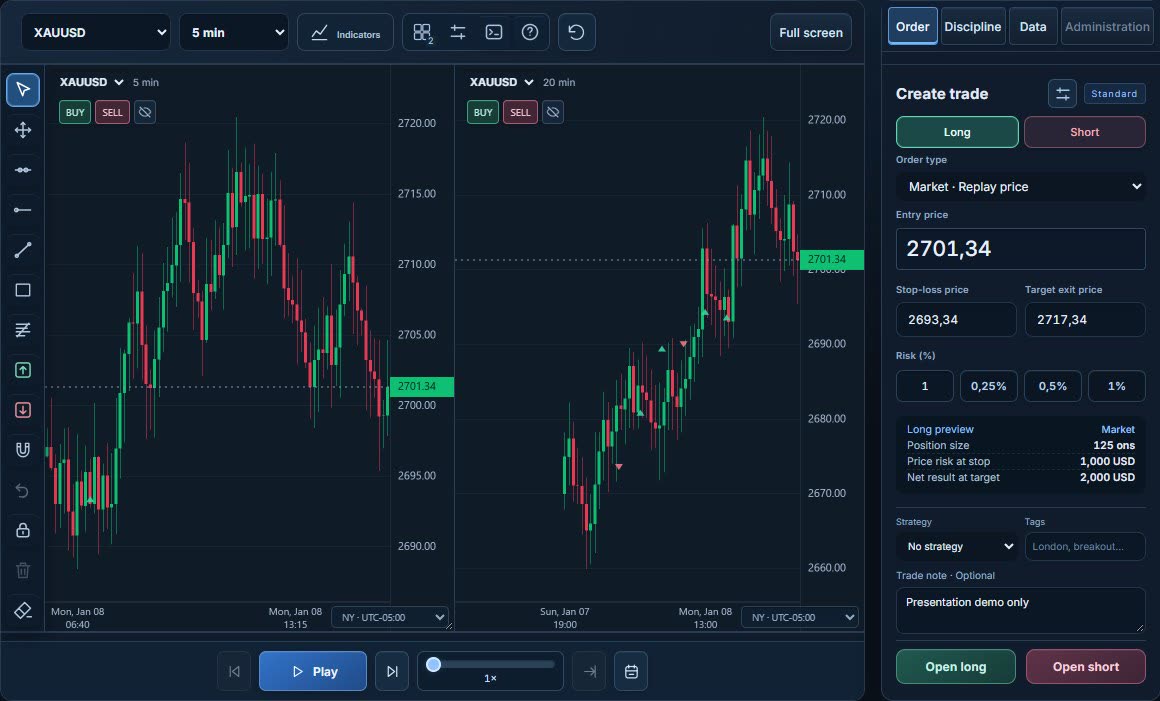
Choose Long or Short and set entry, stop and target. From your risk percentage, the panel shows the position size and the net result at target before you open the trade.
Market orders at the replay price, or pending orders
Risk shortcuts: 0.25%, 0.5% and 1%
Trade templates, strategy and tags, plus a note on why you entered
Partial closes and moving the stop to breakeven
No real order is sent; every trade is a simulation.
Trading journal
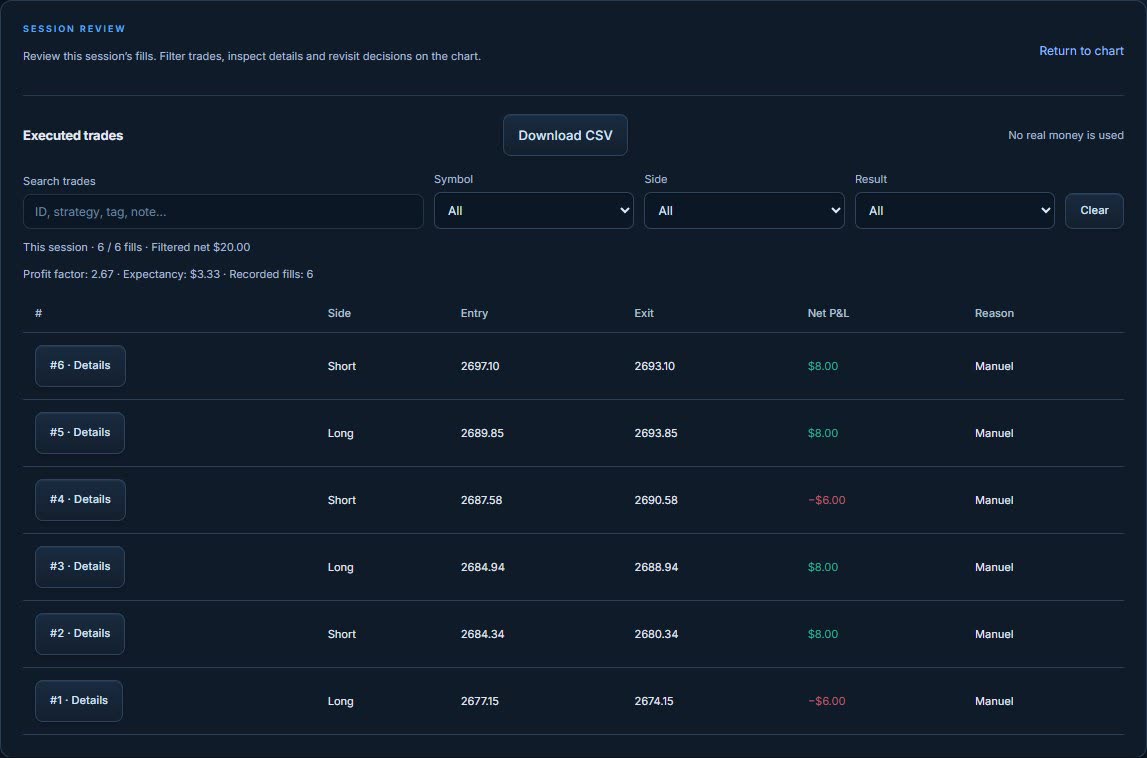
Every trade lands in the journal with its reason, tags, result and costs, so you never have to rely on memory.
Before and after screenshots per trade
Chart journal and strategy notes
Export to CSV and load it back into replay
Performance analytics
As your sessions add up, review every result in one place and narrow it down with filters.
Cumulative net result and trade distribution
R per trade, profit concentration, drawdown periods
Strategy and pair comparison
Weekly progress and session review
RivoScope and the Strategy Lab
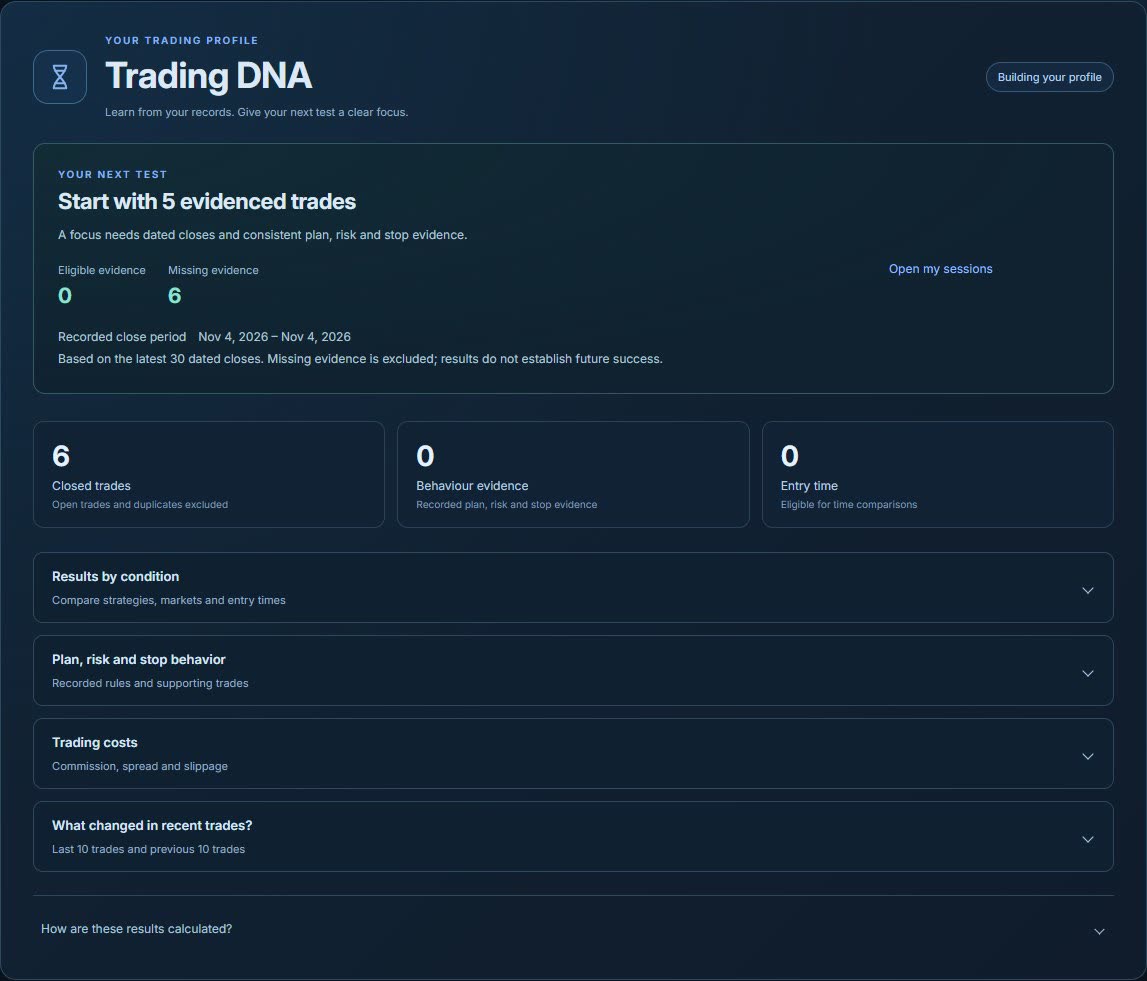
RivoScope finds habits such as plan adherence and stop behavior in your saved trades and shows the evidence behind each one. It flags missing evidence separately and suggests a practice goal. It is not a forecast or investment advice.
In the Strategy Lab you write your strategy as a set of rules, keep versions, attach it to a session and run a rules-based test. Scenario comparison tries different risk and cost assumptions on the same sample.
Records, backup and any device
Your sessions save to your account automatically, so you can pick up on another device right where you stopped.
Search and archive saved sessions
Download a full backup and restore it as new sessions
Turkish and English interface, installable app
Economic calendar and in-app notifications
PLANS
Start free. Upgrade to Pro when you’re ready.
Pro is $13.99 per month or $139 per year. Checkout is not open yet.